Installation
Cloud
Installing the add-on for your Confluence cloud instance is trivial. Simply find the add-on using “Find new apps“ option or install it from the marketplace listing.
Server & DC
Same instruction apply as above with the additional dependency of GraphViz which needs to be installed on your server.
...
This option allows you to use your own PlantUML server as the backend for the add-on. It is only available in server and DC versions.
To access the configuration UI of the add-on, navigate to <confluence_url>/plugins/servlet/plantumlcloud/admin.
...
Using your own PlantUML server allows you to have to setup the backend only once in case of a DC.
Docker
You can run the official docker image using command like below:
docker run -d -p 8080:8080 plantuml/plantuml-server:jetty
...
Adding a PlantUML diagram to a page
Type
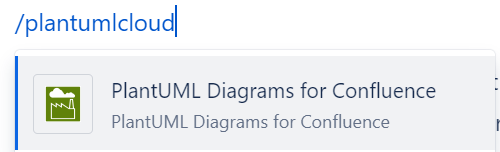
/plantumlcloudin the Confluence page editor.
Select the PlantUML Diagrams for Confluence option.
Type in the diagram markup code in the editor and click publish.
...
The add-on will create two page attachments named after the diagram, one for PNG and the other one for SVG export. The diagram markup is stored only within the Confluence page and nowhere else as per our privacy policy.
Adding a GraphViz diagram to a page
The add-on also supports GraphViz DOT flowcharts using the same plantumlcloud macro:
| Code Block | ||
|---|---|---|
| ||
@startdot
digraph foo {
  node [style=rounded]
  node1 [shape=box]
  node2 [fillcolor=yellow, style="rounded,filled", shape=diamond]
  node3 [shape=record, label="{ a | b | c }"]

  node1 -> node2 -> node3
}
@enddot |
The second line of a Graphviz definition must be of the form:
| Code Block |
|---|
digraph name { |
Note that you can use @startuml / @enduml or @startdot / @enddot, both will work. Only the DOT language is supported.
Viewing the diagram on a page
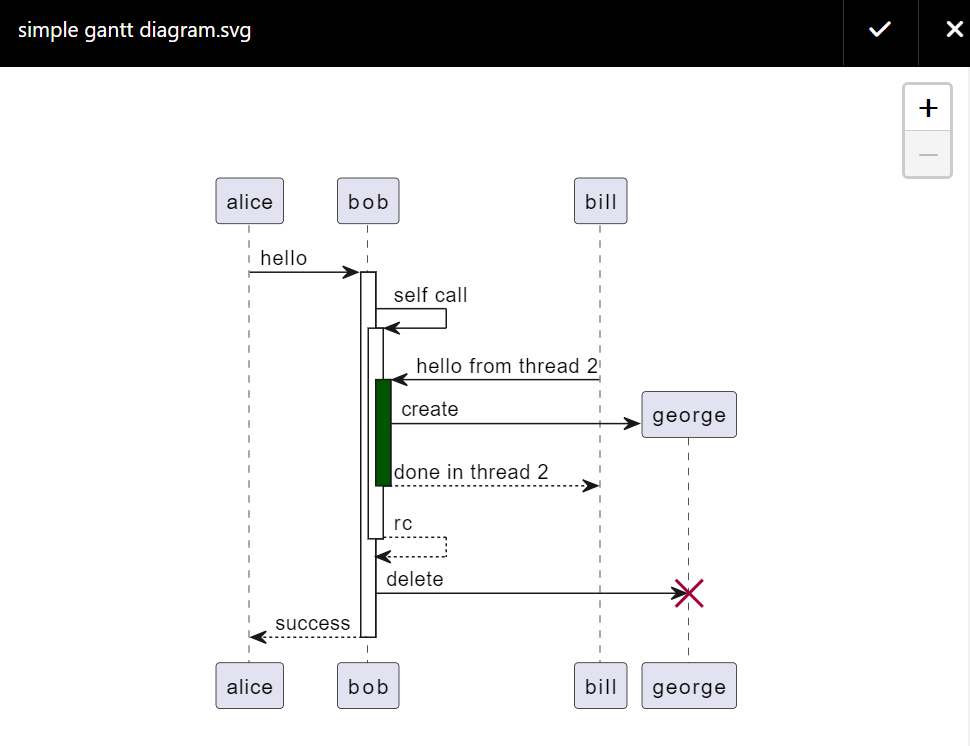
Diagram will be shown on the page in the SVG(Scalable Vector Graphics) format allowing for high resolution zoom.
Below is the screenshot of the sample page.
...
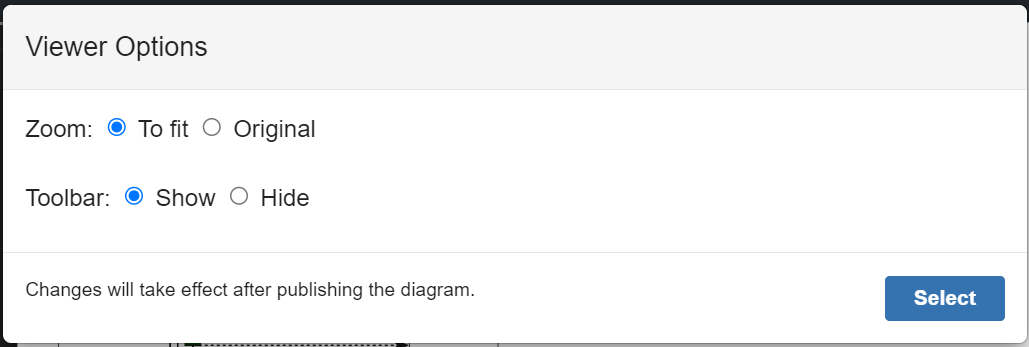
Viewer Options
Viewer can automatically scale to fit or shown the diagram in it’s original size.
Viewer toolbar can be shown on hover or removed completely.
Clicking the icon below in the diagram editor will open the Viewer Options dialog.
...
Full screen viewer
Clicking the Expand icon on the viewer toolbar opens up the full screen viewer which is useful for large diagrams.
...